
Coffee Roasting Datalogging & Automation


for beginners
What is datalogging?
Datalogging in coffee roasting is the tracking of temperatures at different locations inside and adjacent to the roasting drum before and throughout the roast. These temperatures are measured using metal probes called thermocouples and the results are typically tracked on a line graph commonly referred to as a roast curve or roast profile. Essentially, you are tracking the environment you've created inside the drum with your fuel and fan settings and the reaction the coffee seed is having to that environment by tracking the temperature of the bean mass.
The primary use of a roast curve is as a recipe which can later be referenced to verify batch consistency as part of your QC process or to diagnose a machine or venting issue. For experienced roasters, this data can become a biographical roast craft reference and allow for season-to-season referencing of origins, varietals, processing methods and roasting equipment to better predict how a new green should be roasted.
All that being said, you cannot taste a roast curve. Roast curve data will be an invaluable tool in your roasting career but the success (or failure) lies in the cup. Roast curves should always be weighed against tasting & cupping notes.
Frequently asked datalogging questions
Typical temperature tracking
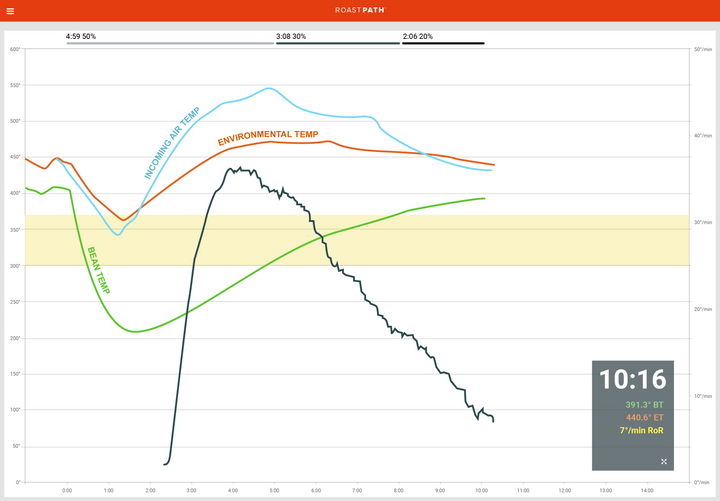
This is a typical layout of a roast curve showing Bean temp, incoming air temp, and environmental temp. RoR (rate of rise), shown with the dark line, is a mathematical measurement of how quickly your bean temp is climbing.
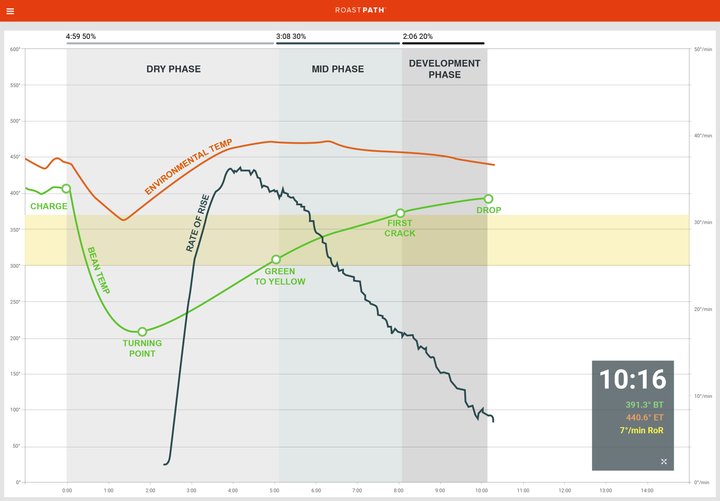
The three major phases of dry phase, mid phase and development phase are derived by using charge, green-to-yellow, first crack and drop as our markers. At the end of the roast, the time in each phase is assigned a percentage of the overall roast time.
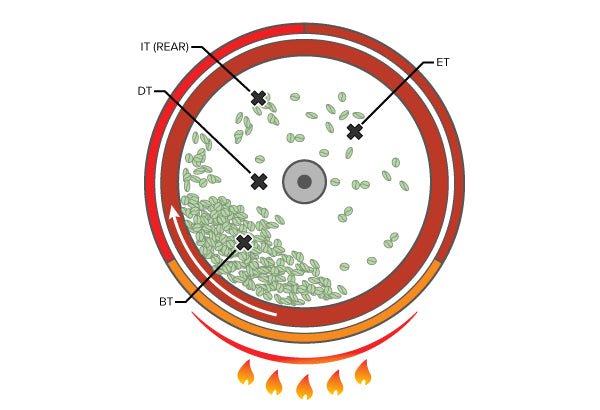
Thermocouple Placement
Bean Temp (BT): Lower right quadrant of drum front. Placed to be centered in the bean mass to make physical contact with the beans.
Drum Temp (DT): Located just left of drum axis on drum front. Measures the average, central drum temp and triggers alarms and auto-shut down if temps exceed safe levels.
Environmental Temp (ET): Upper right quadrant of drum front. Placed opposite the bean mass
Incoming Air Temp (IT): Located at the rear of the drum compartment. Measures air temperature after air passes by the burner set and before it enters the roaster drum.
Our first answer is always this: the thermocouple that came with your Mill City Roaster is the best size for that location. We use a mid-size diameter thermocouple that is responsive enough to create an accurate feedback loop but not so responsive that it your data is too noisy to be useful. Thinner thermocouples may respond to temperature changes more quickly but they also pick up outliers that should be dismissed.
Available data by model
Below is the data offered by each of our Mill City Roasters models via the USB connection on the control panel. Also noted is which models are Roast Replay™ and automation capable when using RoastPATH® as your datalogging software.
| Bean Temp |
Drum Temp |
Environ. Temp |
Incoming Air Temp |
Digital Drum Pressure |
Fan (Hz) |
Fuel (kPa) |
Drum |
Operator Assist features |
Roast Replay™ and automation capable with RoastPATH®? |
|
| MCR500 | ✔ | ✔ | ✔ | ✔ | ||||||
| MCR-1 | ✔ | ✔ | ✔ | ✔ | ||||||
| MCR-2D | ✔ | ✔ | ✔ | ✔ | ✔ | ✔ | ✔ | ✔ | ✔ | ✔ |
| MCR-3 | ✔ | ✔ | ✔ | ✔ | ||||||
| MCR-3D | ✔ | ✔ | ✔ | ✔ | ✔ | ✔ | ✔ | ✔ | ✔ | ✔ |
| MCR-6 | ✔ | ✔ | ✔ | ✔ | ✔ | ✔ | ✔ | ✔ | ✔ | ✔ |
|
MCR-10 |
✔ | ✔ | ✔ | ✔ | ✔ | ✔ | ✔ | ✔ | ✔ | ✔ |
| MCR-15 | ✔ | ✔ | ✔ | ✔ | ✔ | ✔ | ✔ | ✔ | ✔ | ✔ |
| MCR-20 | ✔ | ✔ | ✔ | ✔ | ✔ | ✔ | ✔ | ✔ | ✔ | ✔ |
| MCR-30 | ✔ | ✔ | ✔ | ✔ | ✔ | ✔ | ✔ | ✔ | ✔ | ✔ |
| MC-60 | ✔ | ✔ | ✔ | ✔ | ✔ | ✔ | ✔ | ✔ | ✔ | ✔ |
Readable data by platform
We built RoastPATH® specifically to manage the extra data and capability our coffee roasters were design to offer the modern coffee professional and other platforms are still able to read the data they typically display as well.
| Artisan | Cropster® | RoastPATH® | |
| Record BT | ✔ | ✔ | ✔ |
| Record DT | ✔ | ||
| Record ET | ✔ | ✔ | ✔ |
| Record IT | ✔ | ✔ | ✔ |
| Record fuel adjustments | ✔ | ||
| Record fan adjustments | ✔ | ||
| Record drum speed adjustments | ✔ | ||
| Auto-record charge time & temp | ✔ | ||
| Auto-record turning point time & temp | ✔ | ||
| Auto-record drop time & temp | ✔ | ||
| Roast Replay™ automation | ✔ |